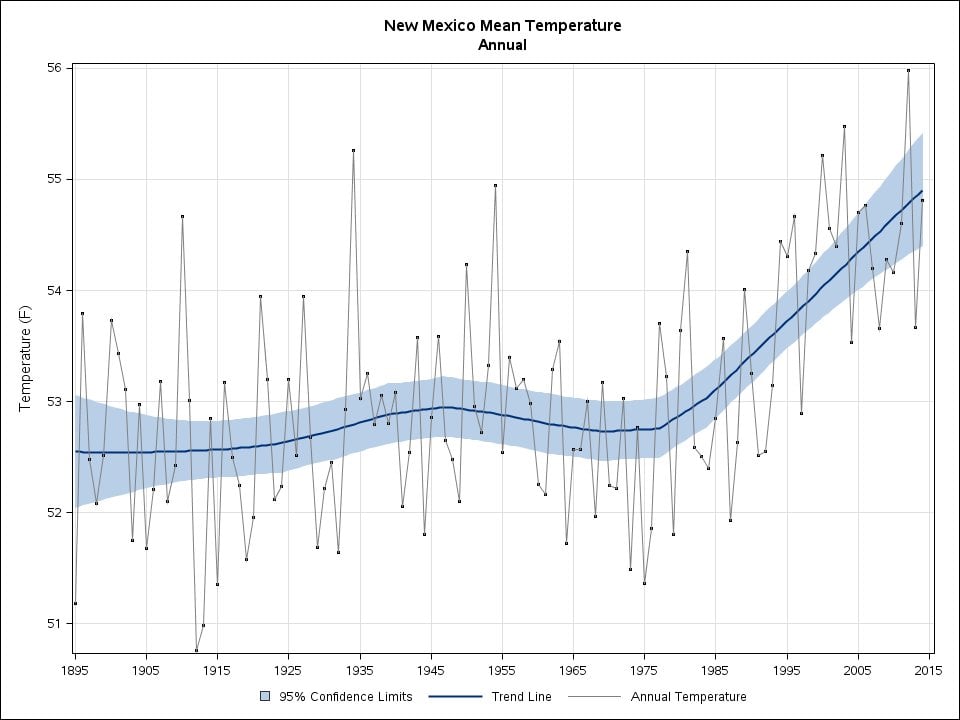
Yesterday, the National Weather Service in Albuquerque Tweeted out a graph showing the dramatic rise in statewide temperatures between the late nineteenth century and today.

NWS, Abq
The National Weather Service in Albuquerque Tweeted out a graph showing the dramatic rise in statewide mean temperatures between the late nineteenth century and today.
NWS meteorologist Deirdre Kann writes in an email to NMID that the figure is based on average state temperatures based on observational records. The agency has many stations in New Mexico that have been reporting and recording temperatures for more than a century.
“This trace is what you will see at many, albeit not all, plots for individual sites,” she writes. “It clearly demonstrates climate warming that is particularly pronounced in the western U.S. It also nicely depicts year-to-year variability — some can be explained but not all.”
Oh, and by the way? Today, the state is expected to experience dry, breezy conditions — and near-record high temperatures.
New Mexico’s Rep. Steve Pearce doesn’t think there is any human-made global warming. And if he keeps avoiding the data AFTER 1985, I can see why he’d keep making that claim.