I began looking for Cleveland High School’s report card with the simple Google search “New Mexico school report cards.” The first listing was School Grading – New Mexico Public Education Department.

Source: PED
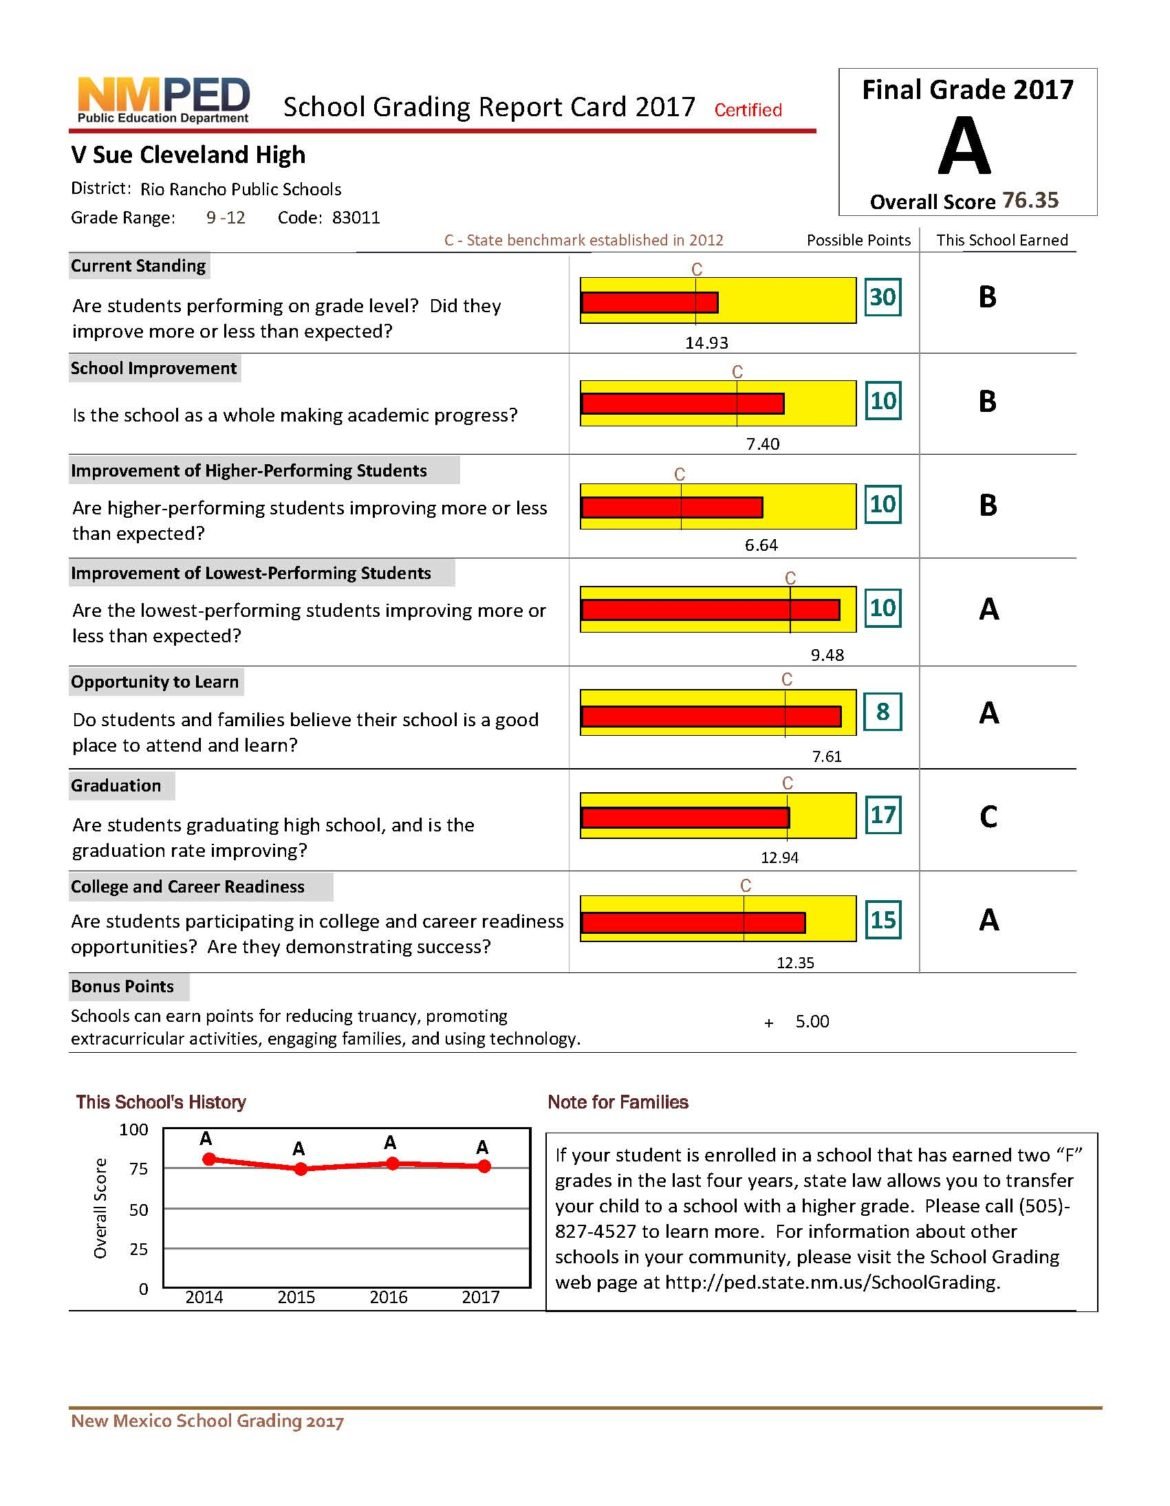
The Public Education Department’s school report cards were lauded by the Data Quality Campaign for their easy to access, quick summaries of New Mexico schools in a report called Show Me the Data 2017. This report card is from Cleveland High School in Rio Rancho, which received an A from the PED.
I followed the link straight to PED’s school grading portal. It was easy enough from there to get to the Rio Rancho school district and the high school. Clicking on the map marker (labeled with an A), I was able to bring up a link to Cleveland’s report card. Yep, it’s an A-grade school.
The ease with which I found the report card, the A to F rankings, simple language and the fact that I could read it in Spanish has earned New Mexico its own top marks from the Data Quality Campaign, a nonprofit group that promotes the use of data to improve education in the United States.
It’s important to note the report doesn’t analyze how well the state measures progress for individual schools — the PED’s methodology has been the subject of fierce debate in New Mexico — but the effectiveness of the state’s communications with the public.
The group released its Show Me the Data 2017 report Wednesday, highlighting New Mexico as one of five states communicating effectively with parents about how their children’s schools measure up statewide.
Here’s what it liked about New Mexico’s report cards:
- New Mexico features clear, summarized ratings on page one that allow users to quickly get a sense of how a school performs overall.
- Indicators are explained in plain language and help the user understand the value of the information.
- Easy-to-find Spanish language translations mean more people can access the information.
The group judged states and the District of Columbia on how quickly they posted testing data, and whether that information was broken down into subgroups such as race, ethnicity, gender, English language learners and students with disabilities; how easy it was for parents to understand the language used in the report cards, such as whether it had lots of jargon and acronyms (it said many report cards were written at an advanced college level); and how difficult it was to find.
“Report cards are a key means for states to communicate education goals, progress and quality to broad audiences. When you use jargon, write at a grade 15 level and speak only English, you’re missing a critical communication opportunity with your most important audiences,” said Paige Kowalski, executive vice president of the Data Quality Campaign during a conference call to talk about the findings of its report.
New Mexico’s school rating system has gotten a lot of push-back from educators as being incomprehensible and riddled with errors. Sen. Mimi Stewart, D-Albuquerque, a longtime critic of the grading system, told the New Mexican in 2016 that it isn’t a good indicator of whether “a school is doing a good job of educating children.” It doesn’t take into account the challenges facing children in poverty and English-language learners, she said. In the same article, then-education secretary Hanna Skandera touted the A-F grades, saying nearly 70 percent of schools maintained their grades or improved over the past year, which she said showed “our students are better off than four or five years ago.”
The group’s report doesn’t wade into that debate. Kowalski said the accountability system and report card are two different things. A debate over what factors an education system tracks and how it ranks them is a good conversation to have, she said, but once those decisions are made, it’s important to communicate that information clearly.
“If your state has a system in place with multiple indicators and a summative rating, that information should be made available in an easy-to-find, accessible, meaningful way to the public,” she said. And the easy to understand A through F system is one that their own polling showed was preferred by 9 out of 10 parents.
I read Cleveland High School’s report card, which is easily accessed by anyone with a smartphone. PED provides a six-page PDF summarizing a school’s progress in seven categories: percent of students performing at grade level, school improvement, improvement of higher-performing students, improvement of lower performing students, opportunity to learn, graduation rate, and college and career readiness, all with their own corresponding letter grade.
Source: PED
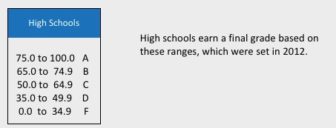
How PED translates points on its assessments into letter grades.
It gave a quick snapshot of how PED ranks Cleveland High School. I suspect many busy parents won’t get past page one, or even past “A.” They should. Despite having an A grade, just over half of Cleveland’s students are rated proficient in reading; less than a quarter are proficient in math on the state’s standardized tests, which themselves are hotly debated. The point system also seemed to be “graded on a curve,” with A’s handed out for points ranging from 75 to 100. I seem to recall a 75 was a C when I was in school.
Still, to give PED the credit the Data Quality Campaign and its report does, that’s all in the report card. Parents and community members can look at the data and weigh how PED rates those factors for themselves.