This article was produced for ProPublica’s Local Reporting Network in partnership with New Mexico In Depth. Sign up for Dispatches to get stories like this one as soon as they are published. And sign up here for journalism from New Mexico In Depth.
New Mexico In Depth and ProPublica used data from the New Mexico Public Education Department to analyze student discipline rates across the state. The news outlets found that one district, Gallup-McKinley County Schools, played an outsized role in the disproportionate discipline of Native American students in the state. That district enrolls more Native students than any other public school district in the United States and a quarter of Native students in the state.
Through public records requests, the news organizations obtained a spreadsheet of all disciplinary incidents reported by school districts to the state Public Education Department. The data was extracted from the state’s public schools database, called the Student Teacher Accountability Reporting System, and covered the 2010-11 to 2021-22 school years.
We chose to analyze multiple recent years to account for fluctuations in discipline from year to year. Discipline data for the 2020-21 school year was not included in our analysis because of school closures during the pandemic. Data for 2021-22 was excluded as well because it was incomplete. Ultimately, our analysis focused on the 2016-17 to 2019-20 school years.
To calculate the annual discipline rate per 1,000 students, we used state enrollment figures covering the same years, also from STARS. To compare the district’s Native student population to other districts nationwide, we used data from the National Center for Education Statistics, which showed Gallup-McKinley enrolled more Native students than any other public school district in the 2021-22 school year, the most recent year for which national data is available.
Because of how race and ethnicity are reported in state enrollment and disciplinary data, any student who identifies as ethnically Hispanic, which includes some Native Americans, is counted only as Hispanic. Hispanic students make up about 18% of the Gallup-McKinley student body, while Native Americans make up about 73% as of the 2021-22 school year. Both groups were disciplined at similarly high rates compared with white students. However, because Gallup-McKinley accounts for a much smaller portion of the state’s Hispanic students, the district’s high discipline rates did not significantly impact statewide Hispanic discipline rates.
Our analysis included disciplinary incidents involving students from kindergarten through 12th grade. The enrollment data used for our rate calculations included pre-kindergarten students; the Public Education Department did not provide data that allowed us to remove those students from all of our rate calculations. Pre-kindergarten students make up a small percentage of overall enrollment; including them in our denominator slightly reduced calculated discipline rates.
We included charter schools that are part of traditional school districts as well as alternative learning environments such as home schools that are included in districts’ reports. Statewide, they account for roughly 5% of student enrollment and 1% of infractions. Our analysis excluded charter schools that are treated as their own school districts, which enroll about 5% of the state’s students.
Each record included a “Discipline Response” field, which noted the most severe punishment imposed for a given infraction. School district staff choose from a list of options to populate this field. The options include “Expulsion” and “Modified Expulsion,” in which expelled students receive some educational services. We included both when tallying expulsions.
Arrests and referrals to law enforcement are grouped in a single option in the “Discipline Response” field, called “Arrest/referral to justice system.” That meant we were unable to determine the precise number of arrests. Referrals mean calls to law enforcement agencies or to the state-run juvenile probation office.
The data included a separate “Criminal Charge Code” field, which is meant to indicate whether a police report had been filed, according to the STARS manual. A few districts contacted by New Mexico In Depth and ProPublica said they use this field to record when they call law enforcement, instead of selecting the “Arrest/referral to justice” system option in the “Discipline Response” field. (Gallup-McKinley officials did not respond to multiple requests over a period of months to discuss their discipline practices and data entry.) When referring to incidents involving law enforcement, we included any record marked with “Arrest/referral to justice system” or “Criminal Charge Code.”
During the time period we analyzed, if a student faced multiple types of discipline (such as an arrest and suspension), schools were instructed to record only the most severe punishment, according to the STARS manual. The most severe punishment in the system is “Arrest/referral to justice system,” and the second-most severe response is expulsion. As a result, if a student was arrested and expelled in response to an incident, it may appear only as an “Arrest/referral to justice system” in the data. State officials told us they don’t know how often that happened.
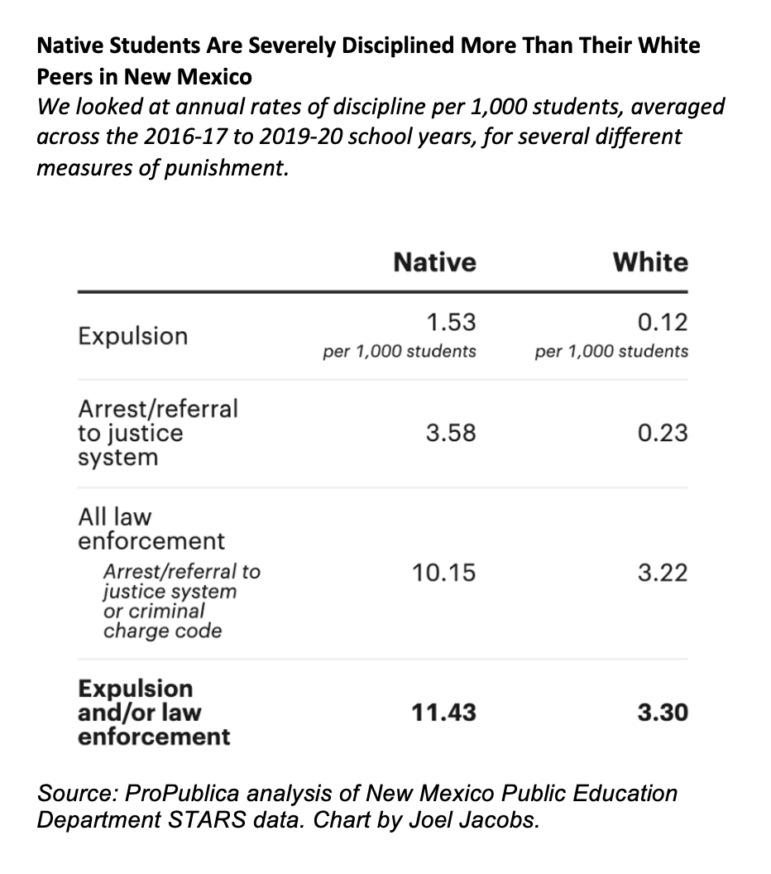
Not accounting for incidents marked as “Arrest/referral to justice system,” Native students had an expulsion rate roughly 13 times that of white students statewide from the 2016-17 to the 2019-20 school years. If all arrest/referral incidents of white students involved expulsions, and none of Native students did, this disparity was reduced to four times. We used the most conservative figure in our story, although the true disparity is likely larger. We used a similarly conservative method when comparing Gallup’s expulsion rate to the rest of the state.
Here are the details on how we reached our conservative estimates:
- To compare Native and white expulsion rates, we divided the Native expulsion rate (1.53) by the sum of the white rates for expulsion and arrest/referral to the justice system (0.12 + 0.23).
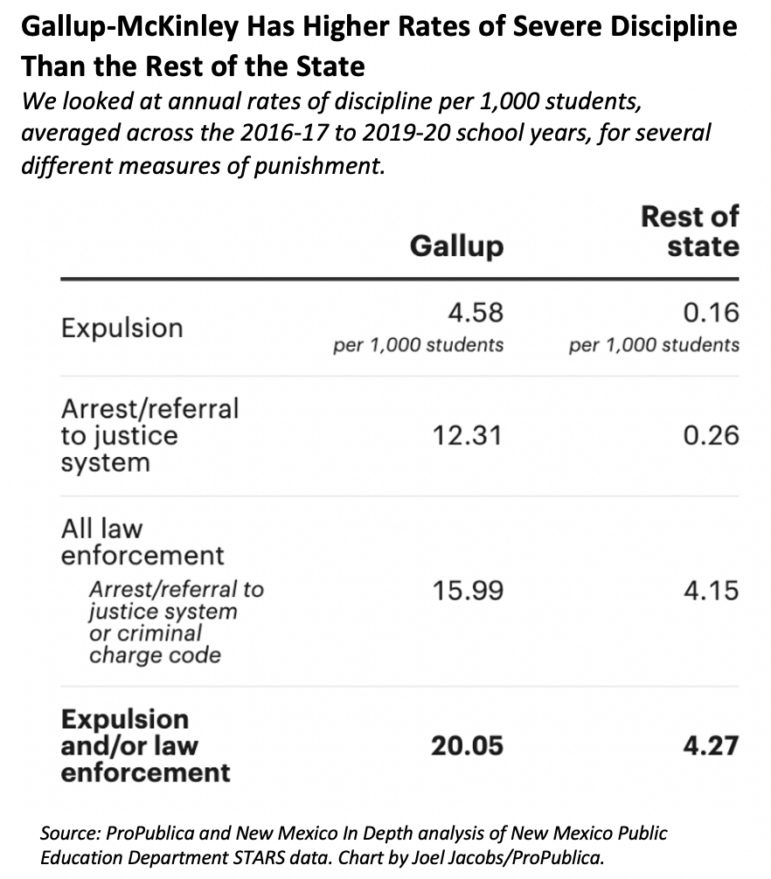
- To compare Gallup-McKinley and the rest of the state, we divided the district’s expulsion rate (4.58) by the sum of the rest of the state’s rates for expulsion and arrest/referral to the justice system (0.16 + 0.26)
When analyzing the data, we found about 20 cases in which a school district, including Gallup-McKinley, reported few or no disciplinary incidents for the first several months of a school year, despite reporting significant numbers in the rest of the year. We ran a separate analysis to account for those gaps, which produced similar findings.
Because of the limitations of the “Discipline Response” field and differences in how districts report law enforcement interactions, we compared rates across a variety of measures. For all measures of severe punishment, stark disparities persisted between Gallup-McKinley and the rest of the state and between Native American and white students statewide.